The Normal Seasonal Cycle of Home Sales in DuPage county
Thinking about the real estate market? Thinking about what your house is worth? Did you know its worth more in different times of the year?
Over a decade ago I had my first kid and got my real estate license. I knew I didnt want to go into construction like the rest of my family and I took a big jump into an unknown industry. Now 5 kids later and a few hundred homes sales under my belt I understand one thing really well. Real estate has a cycle, each year its all the same.
Spring is a big push, July is the top December is the bottom. We have two bumps in there School and pre holiday.
Here is some data to back up what I have experienced.
- January–February: Slowest months of the year (~650–675 sales). Winter and post-holiday slowdown.
- March–June: Rapid acceleration as buyers and listings return.June is the annual peak (~1,540 sales).
- July: Noticeable pullback as families travel.
- August: Small rebound from buyers rushing to close before school starts.
- September–October: Final buying window before the holidays.
- November–December: Gradual decline into year-end (~920 sales).
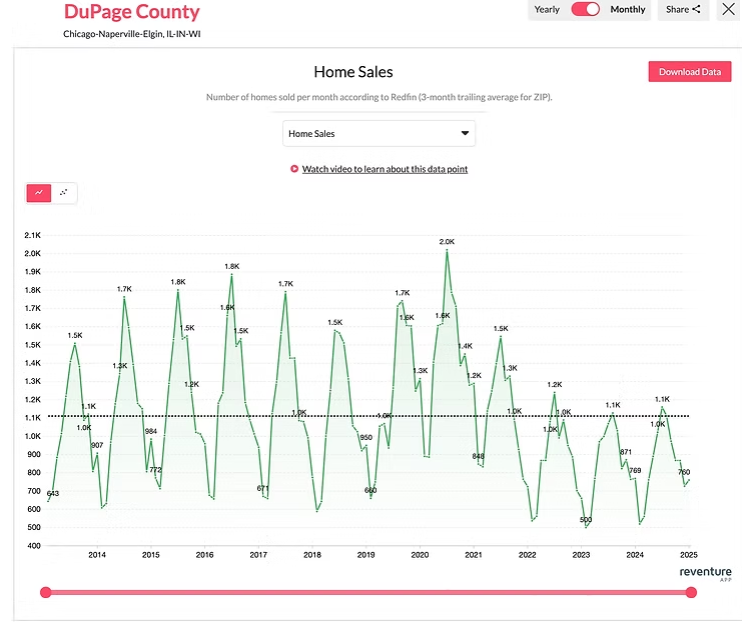
The chart above shows the average number of homes sold per month across multiple years .Here is the breakdown of the Seasonal Cycle Dupage County
January–February: The Annual Low Point
January and February consistently mark the slowest period of the year.
- January averages ~660 home sales
- February averages ~675 home sales
Cold weather, post-holiday fatigue, and limited listings keep activity muted.
March–June: The Acceleration Phase
Starting in March, the market shifts quickly.
- March breaks 1,000+ sales
- April and May climb steadily
- June is the clear peak, averaging ~1,540 home sales
This is when:
- Inventory peaks
- Buyer urgency increases
- Pricing pressure builds
June is historically the strongest month of the year in DuPage County.
July: The Vacation Pullback
After June, sales dip.
- July averages ~1,425 sales, down from the June peak
People travel this month.
August: The Back-to-School Surge
August produces a secondary peak.
- Average sales rebound to ~1,370 homes
These are buyers who delayed during summer travel and now need to close before school starts. This bump is highly consistent year to year.
September–October: The Pre-Holiday Window
Early fall delivers one last opportunity window:
- September averages ~1,130 sales
- October averages ~1,090 sales
These buyers want stability before the holidays and winter weather.
November–December: The Slow Fade
Activity declines into year-end:
- November and December average ~920 sales
- Momentum resets heading into January
If you want to jump in this year and find a house give me a call or text I would be happy to help you.